User Guide#
Quick start#
You can install this extension from PyPI using:
pip install -U jupyterlab-ui-profiler
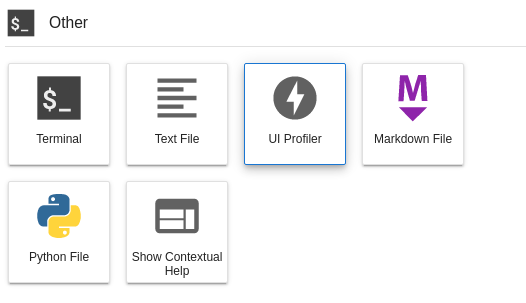
The ui-profiler can be started from Launcher’s “Other” section:
Interface#
You can select multiple benchmarks (left) and multiple scenarios (right) at once. Configuration options for benchmarks and scenarios will show up when selected.
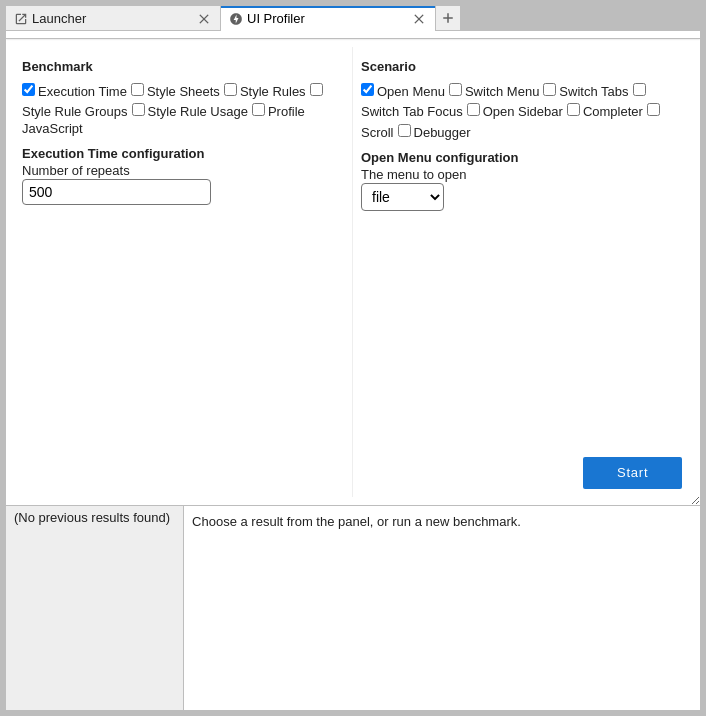
After you selected the desired benchmarks and scenarios press .
For best results do not click, change focus or move your mouse after pressing
most scenarios can be run when the browser window is blurred, but switching to CPU- or memory-heavy workload in another process may introduce additional variability
most scenarios will pause running if you switch the tab (because
window.requestAnimationFrameis used to synchronise execution with layout/paint events and it gets paused in background tabs)
Results#
The results will show in the area below the benchmark launcher:
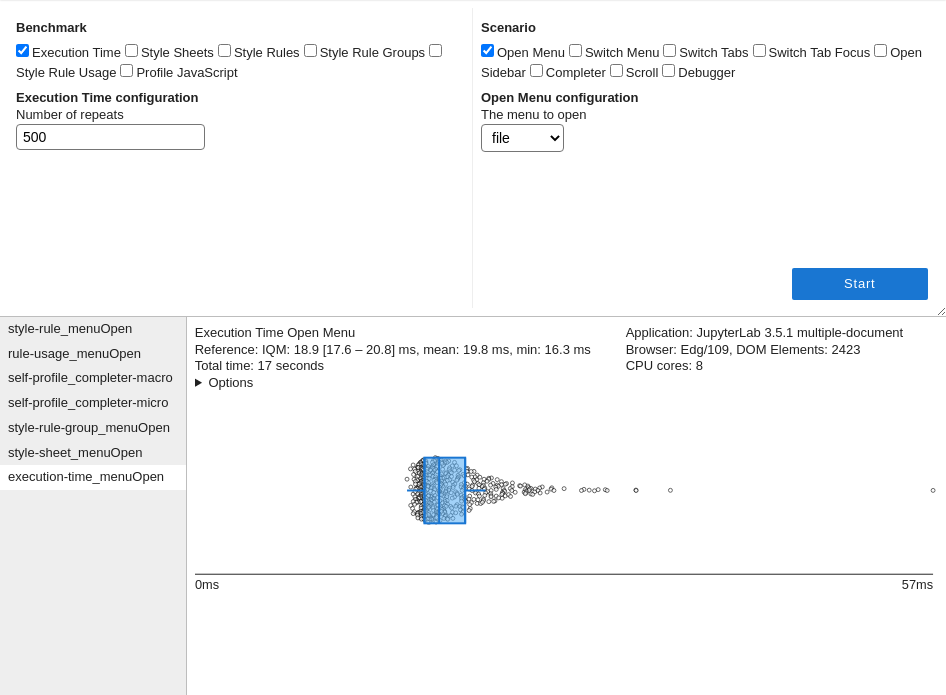
The summary of the benchmark run (left) and runtime environment (right) is shown at the top. You can hover over individual items to see more details (e.g. over “Reference” to see the list of times, over “Browser” to get detailed user agent information).

You can click on > Options to view the configuration with which the benchmark was run.

Tables with results can be sorted by clicking on the headers (click twice to reverse order), and columns can be resized by dragging edges of the headers.
Results history#
Results are stored in .profile.json files in ui-profiler-results directory (automatically created if needed) directly below the root directory of JupyterLab.
If you want to remove a result from history you can remove the corresponding file directly; similarly if you want to preview a result generated on a different machine/instance you can copy it into the ui-profiler-results directory.
The newest results are placed at the top of the list.
Measuring execution time#
Note: The execution time is measured using
performance.now()method which has reduced resolution in certain browsers/setups.To enable high-precision timings in Firefox (79+) we send additional HTTP headers:
Cross-Origin-Opener-Policy: same-originandCross-Origin-Embedder-Policy: require-corpwhich may interfere with user experience (for example restricting the download of images from third-party servers). If this is undesirable, disable the server extension with:jupyter server extension disable jupyterlab_ui_profiler
Available settings#
- Number of repeats (integer, default=500)
Interpretation#
In general performance timings are easily skewed towards higher values by external tasks such as garbage collection, activity of browser extensions or CPU utilisation by external processes. We recommend sorting by first quartile as default, with empirically second-best option being inter-quartile mean - but this varies by benchmark and scenario.
For benchmarking of individual actions, box plot visualisation is provided. Hover over the circles, box lines, and whiskers to get details about the individual datapoints/statistics.
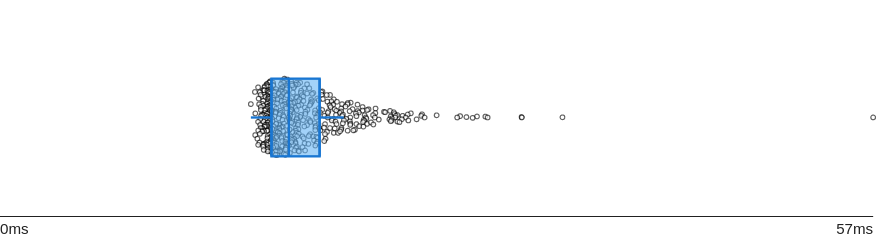
The box represents 1st, 2nd (median) and 3rd quartile and whiskers correspond to minimum/maximum or 1.5 IQR away from the 1st/3rd quartile, whichever is smaller.
Troubleshooting#
If the timings in Firefox are of low resolution even though headers are sent properly, check your privacy settings, especially privacy.resistFingerprinting.
Benchmarking CSS styles#
Four benchmarks are provided for CSS styles:
Style Rules: provides information on CSS rule performance by disabling rules one-by-one, but takes a long time to iterate over every single rule available
Style Sheets: disables entire CSS style sheets at a time; it is faster than disabling rules one-by-one, and more efficient when offending styles come from a single extension
Style Rule Groups: allows to triangulate the offending rules or group of rules by disabling them block-by-block and then calculating an average contribution of each rule based on the runtime of each block
Style Rule Usage: observes DOM modifications to calculate the frequency of usage for rules deemed relevant to the investigated scenario
The results are presented in an interactive table which includes a set of columns shared between all CSS benchmarks (below) as well as benchmark-specific columns.
The timings and statistics in table refer to execution time after disabling the rule/group of rules:
times: measured execution times for each of the repeatsmin: fastest execution timemean: average execution timeIQM: inter-quartile mean execution timeΔIQM: change in IQMQ1: first quartile of execution timeΔQ1: change in first quartile
Other common columns are:
errors: list of errors encountered during scenario execution (only present if any errors were encountered)stylesheetIndex: index of the style sheet among all stylesheets on the pageruleIndex: index of the rule within the source stylesheetsource: the path to the source stylesheet if available. 📦 is an abbreviation fornode_modules(locally developed/source extensions will not have a 📦 prefix)
Nomenclature#
Rules are defined as groups of properties:
<!-- sheet start -->
<style>
  /* rule start */
  .jp-MainAreaWidget  /* selector */
  {
    color: red;       /* property */
    border: 1px;      /* property */
  }
  /* rule end */

  /* rule start */
  .jp-Notebook {
    display: block;
  }
  /* rule end */
</style>
<!-- sheet end -->
Limitations#
Rules with pseudo-selectors and pseudo-classes in selector (e.g. :hover) cannot be invoked programatically, and therefore this ui-profiler cannot rule out performence bottlenecks resulting from such rules.
Style Rules#
Available settings#
- Number of repeats (integer, default=3)
- Regular expression to filter out rules (string, default='(fa-|Icon|bp3|mod-hidden)')
- Regular expression to filter rules to include (string, default='')
Interpretation#
Negative Δ highlights rules which may be deteriorating performance.
Due to multiple testing expect an enrichment of false positives which decreases as you increase the number of repeats. Empirically order of magnitude of 100 repeats is needed to minimise the false positives.
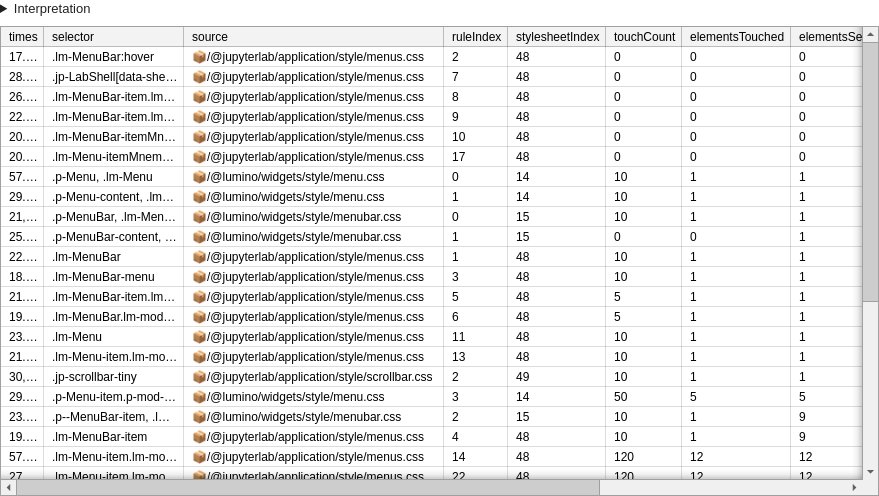
Example result scenario for menu opening scenario with 10 repeats:
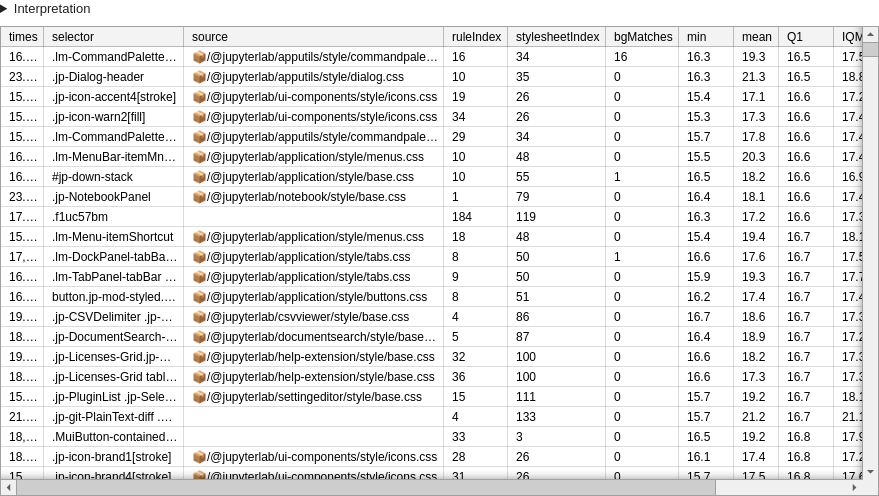
This example demonstrates the issue of false positives well: only .lm-MenuBar-itemMnemonic and .lm-Menu-itemShortcut are relevant.
Benchmark-specific columns:
bgMatches: how many elements matched the rule at standby (as compared to during scenario execution); mostly useful to find too broad rules, or potentially unused rules with expensive selectors.
Style Sheets#
Available settings#
- Number of repeats (integer, default=5)
Interpretation#
When a stylesheet is highlighted in this analysis, but no individual rule was highlighted in Style Rules analysis, it may indicate a presence of interaction or synergy between rules.
Style Rule Groups#
Available settings#
- Number of repeats (integer, default=5)
- Regular expression to filter out rules (string, default='(fa-|Icon|bp3|mod-hidden)')
- Block size to start with (integer, default=3)
- Maximal block size (integer, default=5)
- Number of sheet randomizations (integer, default=5)
- Regular expression to filter rules to include (string, default='')
Interpretation#
Per-block results may highlight groups of styles degrading performance:
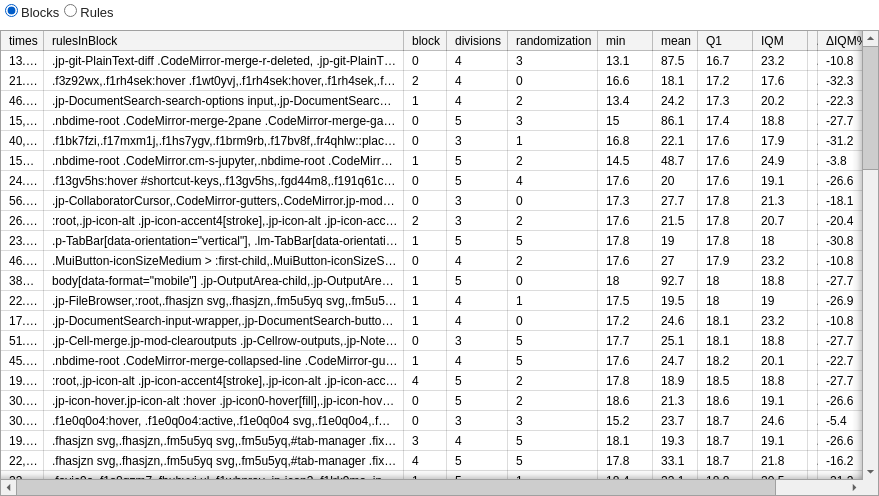
Per-block results are easier to interpret with blocks of smaller size (higher granularity).
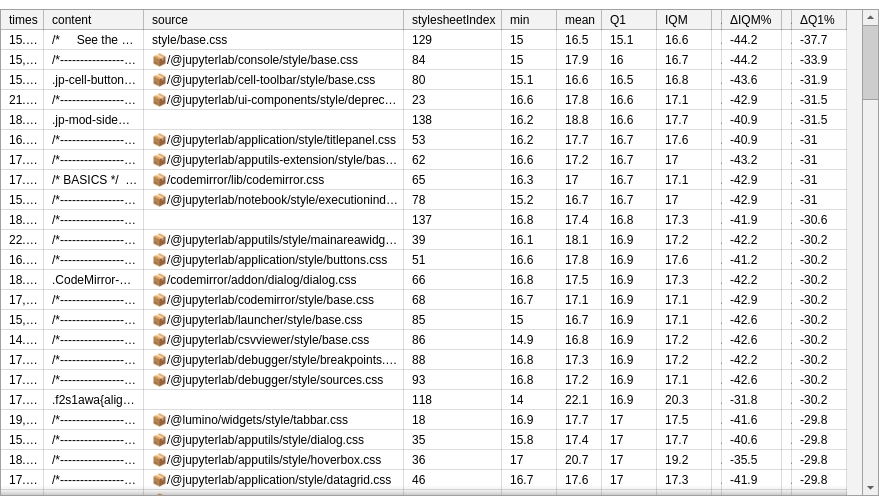
Per-rule averages may be useful to narrow down offending styles:
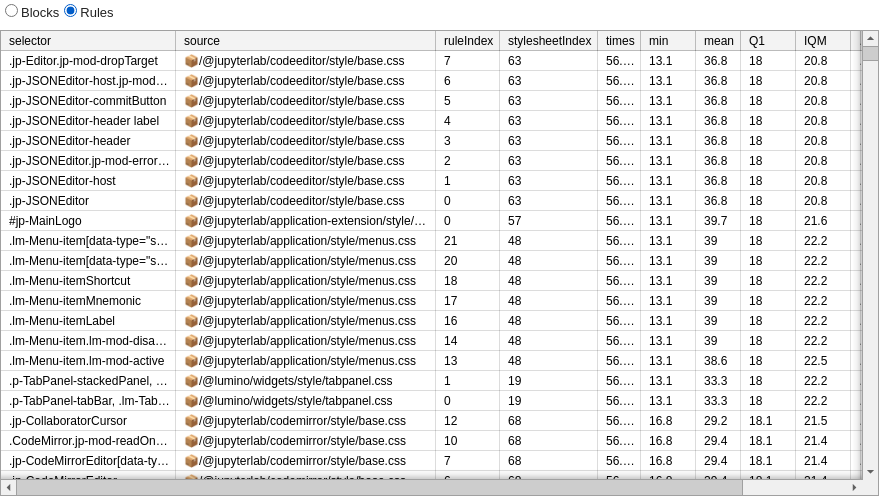
In the above example exclusion of .jp-JSONEditor* or .lm-Menu* styles appears to improve performance. Given, the scenario (opening menu) the former is just coincidence (was selected in the same block more often) and latter indicates relevant styles.
Benchmark-specific columns:
divisions: into how many blocks was the list of styles divided in this run?block: which block of a particular run does this result refer to?randomization: which repeat with re-shuffled list of styles does this result refer to? 0th randomization is using the original order which often has similar styles next to each other (if original stylesheets are written in sensible order)
Style Rule Usage#
Available settings#
- Number of repeats (integer, default=5)
- Regular expression to filter out rules (string, default='::')
- Regular expression to filter out classes used for rule discovery (string, default='(fa-|jp-icon|Icon|lm-Widget|lm-mod-|jp-mod-|p-mod-|p-Widget)')
- Regular expression to filter rules to include (string, default='')
Interpretation#
Benchmark-specific columns:
elementsSeen: how many elements were seen on the entire page when executing the scenario.elementsTouched: how many elements were modified or in the subtree of a modified element when executing the scenario.touchCount: upper bound on how many times the rule matched an element (will be high for rules matching many elements, and for rules matching a single element that is repeatedly modified in the chosen scenario).
Low number of elementsSeen suggest potentially unused rule. Negative Δ highlights rules which may be deteriorating performance.
Benchmarking JavaScript#
At a glance#
Benchmarking JavaScript code enables discovery of functions which contribute to performance bottlenecks.
This feature relies on JS self-profiling API which as of 2022 is only available in Chromium-based browsers.
The self-profiling API relies on sampling method to collect stack (list of frames) at specified sampling intervals.
Available settings#
- Number of repeats (integer, default=100)
- Profiling scale (micro | macro, default='micro'): Whether to take multiple profiles, one for each repeat (mico) or one profile averaging across all repeats (macro). Macro-profiling includes setup and cleanup steps which may bias the results for scenarios where expensive operations are performed in these steps. Micro-profiling may be unsuitable for very fast scenarios, and when the browser limits the sampling interval.
- Sample interval (integer, default=5): Sampling interval (in milliseconds). Browsers are not required to take samples at this rate and may increase it (Chrome uses 16ms on Windows and 10ms elsewhere).
- Sample buffer size limit (number, default=10000): When the limit of samples gets exceeded, the profiling will stop prematurely.
Hints:
for
micromode low number of repeats is often sufficient (e.g. 3), whereasmacromode is intended to be used with high number of repeats (e.g. 50).if
micromode does not catch the frames you want try increasing the number of repeats and scroll through the list of traces to find a repeat with satisfactory number of framesmacromode only averages the numbers in the table - the timeline is showing all repeats in order and this may be prohibitive to render if number of repeats is set to a very high number (e.g. 1000)
Interpretation#
Note: when running on production version of JupyterLab names of functions and classes may be minimized. You can rebuild JupyterLab or use a development version to ease interpretation.
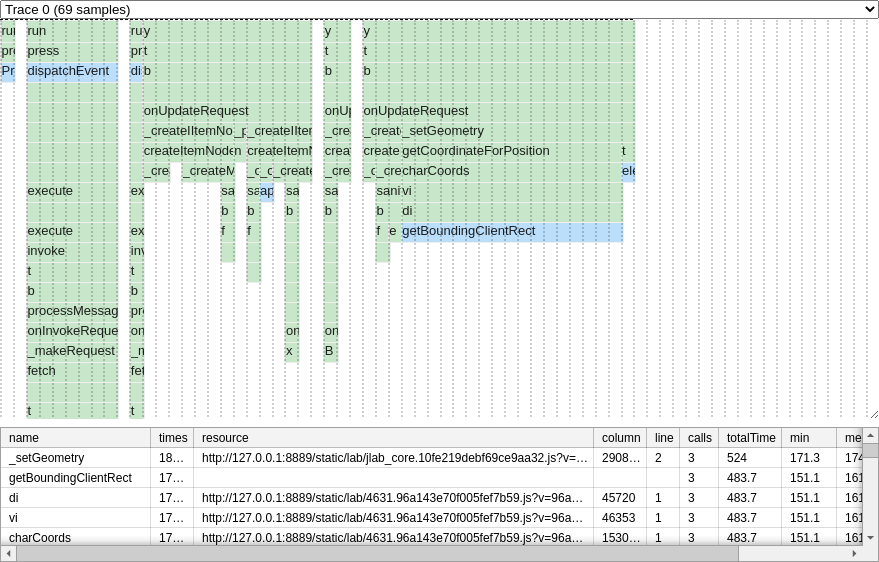
The micro mode provides the timeline for each individual run (repeat) of the scenario with stacks of frames corresponding to the execution stack:
In macro mode all runs are shown together chained in the timeline, but results table averages timings per function across repeats.
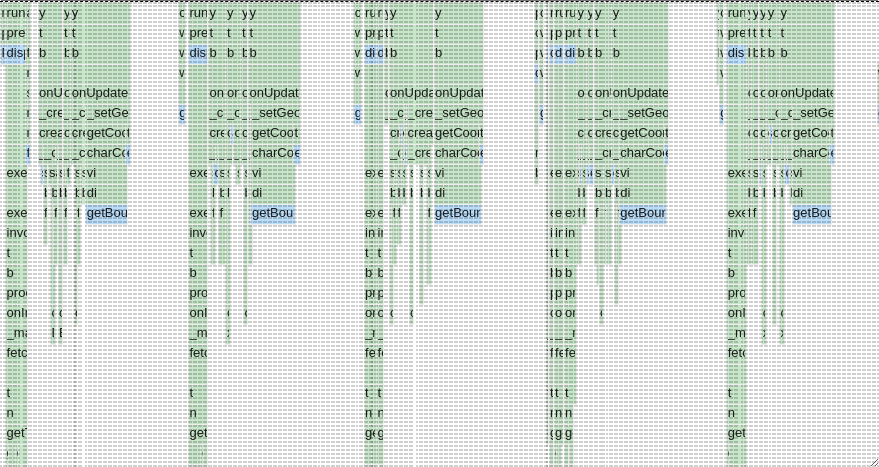
Legend:
blue boxes denote native JavaScript code,
green boxes indicate functions from JupyterLab, JupyterLab extensions or browser extensions,
vertical dotted lines indicate boundaries for specific samples (local resolution of sampling)
Interactivity:
hover over boxes to see execution time,
you can zoom and pan to navigate larger traces,
in the
micromode use the traces selector to choose the repeat which recorded all relevant frames (inmacromode there is only one trace),if the timeline fills the full height of the details section, you can resize it by grabbing bottom-right corner.
Columns:
calls: lower bound for the number of times given function was called (if the call was very fast and happened between samples it could not be recorded and hence would not be counted)column: location in the source file (resource): columnline: location in the source file (resource): line
Troubleshooting#
To enable self-profiling we add Document-Policy: js-profiling header to the settings of jupyter-server (via jupyterlab_ui_profiler server extension).
If the profiler is not available, ensure that the server extension is active using:
jupyter server extension list
if it is active and you have just installed the extension, restart jupyterlab to ensure that it is loaded.
If you use a replacement server (e.g. jupyverse) you will need to add the required header manually or switch to the default jupyter-server for the time of profiling.
Custom scenarios#
Scenarios created via UI#
Starting with v0.3 scenarios can be defined via UI as lists of Jupyter commands (use the “Custom Scenario” checkbox).
JupyterLab 4.5.0 or newer is required to render the forms for inputting arguments for built-in commands.
jupyterlab-ui-profiler ships with a few commands making writing custom scenarios easier:
ui-profiler:wait-for-layout- add this after an action that you want to benchmark to measure the actual time until the change is rendered on screenui-profiler:wait-for-selector- use this to add wait conditions on the DOM state, that cannot be created by just awaiting for results of commands
Programmatic scenarios#
You can define custom scenarios programmatically by creating a JupyterLab extension which consumes IUIProfiler token:
import { JupyterFrontEnd, JupyterFrontEndPlugin } from '@jupyterlab/application';
import { IScenario, IUIProfiler } from '@jupyterlab/ui-profiler';


class MyScenario implements IScenario {
  id = 'myScenario';
  name = 'My scenario';

  async run(): Promise<void> {
    console.log('Running!');
  }
}

export const plugin: JupyterFrontEndPlugin<void> = {
  id: '@my-organization/my-ui-profiler-extension:my-scenario',
  autoStart: true,
  requires: [IUIProfiler],
  activate: (app: JupyterFrontEnd, profiler: IUIProfiler) => {
    const myScenario = new MyScenario();
    profiler.addScenario(myScenario);
  }
}
Please see tokens.ts file for the full documentation of IScenario interface.